Academic Task 1 Writing Course
-
Introduction to Task 1
Introduction to Task 1 -
Task AchievementTypes of graphic and what to include in your answer
-
How to write a Task 1 introduction
-
How to write an overview
-
How to use and compare data in Task 1
-
Coherence and CohesionHow to structure your answer
-
Linking words for Task 1
-
Focus On Different Graphic TypesProcess diagram
-
Practice: Process Diagram
-
Map diagram
-
Practice: Map Diagram
-
Graphics with predictions
-
Practice: Graphics with Predictions
-
Lexical ResourceTask 1 word formation and spelling
-
Vocabulary for surveys and ranking
-
Verbs for describing trends
-
Adjectives for describing trends
-
Describing numerical data
-
Describing periods of time
-
Describing proportions and fractions
-
Grammatical Range and AccuracyCommon grammar mistakes in Task 1
-
Advanced GrammarNon Defining Relative Clauses (Ac. Task 1)
-
Subordinate Clauses (Ac. Task 1)
-
Passive Form (Ac. Task 1)
-
The Past Perfect (Ac. Task 1)
-
Advanced Connectors (Ac. Task 1)
-
Emphasis (Ac. Task 1)
-
Punctuation for Task 1
-
PracticePractice: All Graphic Types
-
End Of CourseEnd of task 1
How to write a Task 1 introduction
- 15 minutes
In this lesson, we look at how to write an introduction for a task 1 answer. Let us know in the comment section below if you have any questions. Once you have finished this lesson, click on the ‘mark complete button’ at the bottom of this page. Happy studying!
Slow video loading? View the Alternative Video Source
Lesson Material
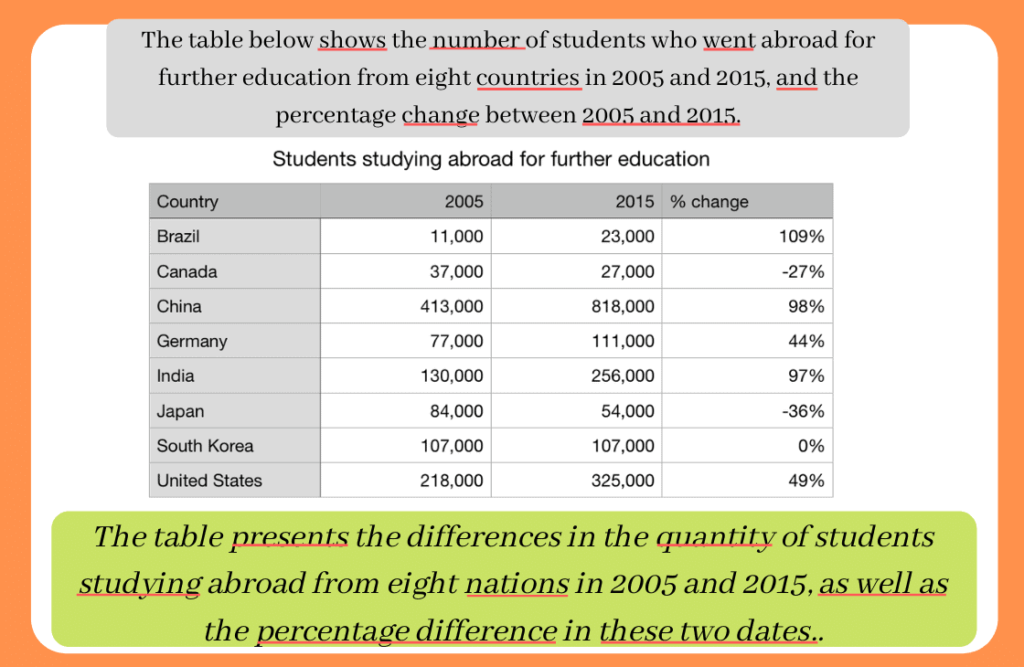
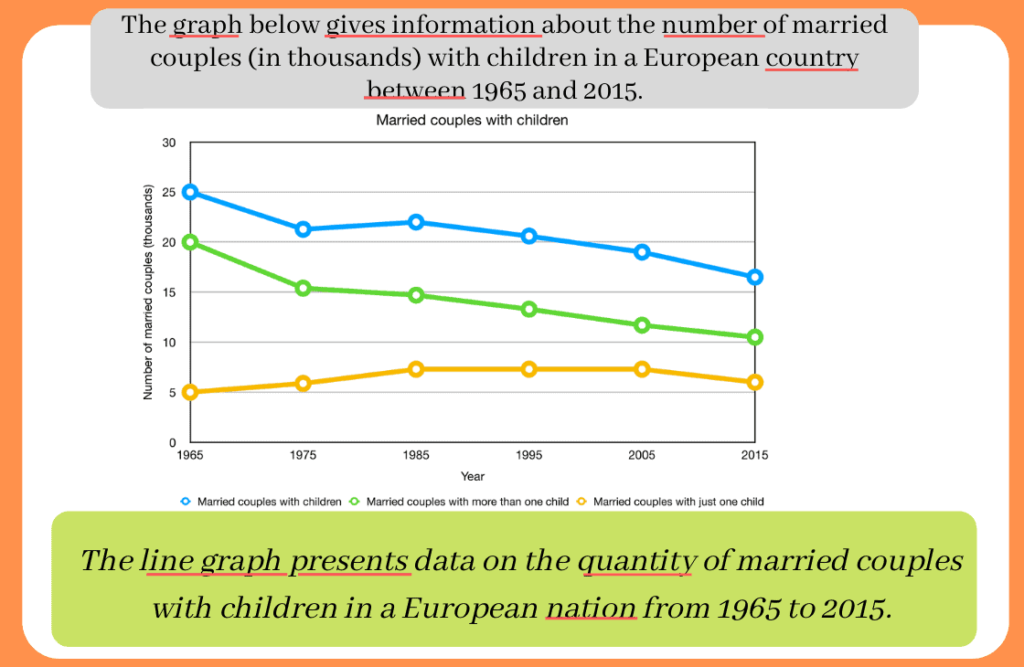
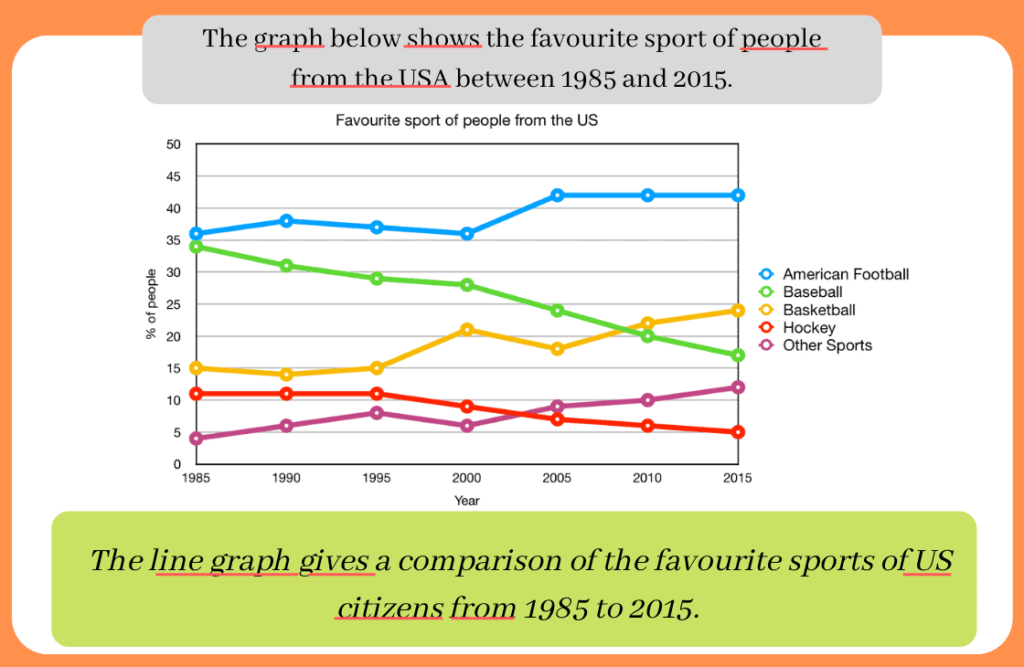
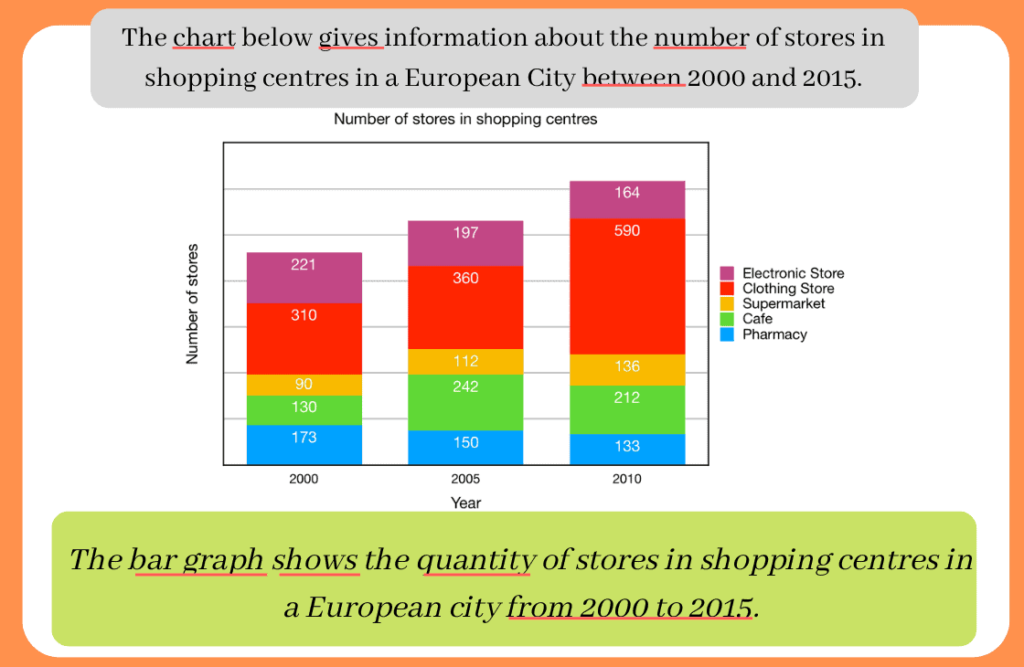
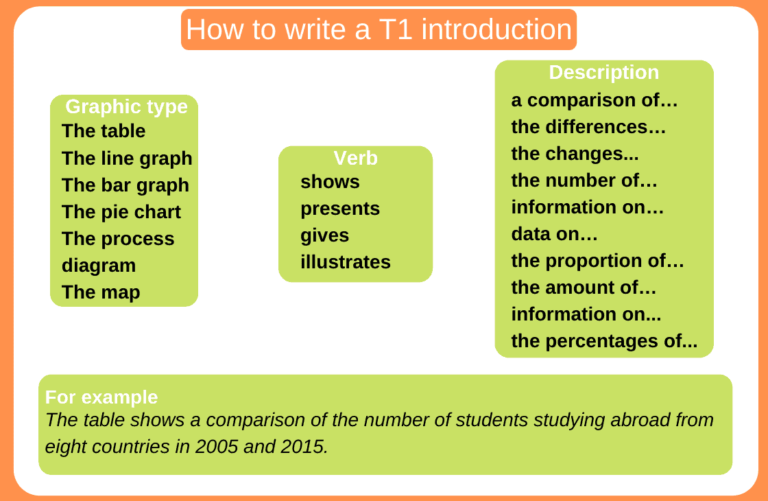
The first paragraph you should write after analysing the graphic, is the introduction. The introduction re-words the description of the graphic.
3 things to do when writing a task 1 introduction
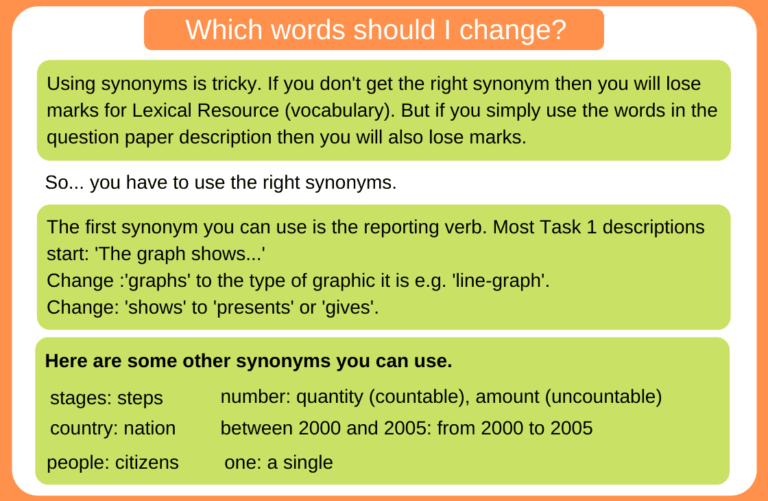
- Use different words (synonyms) from the rubric*. (e.g. the table shows= presents)
- Use different grammatical structures from the rubric. (e.g. number of students who went abroad for further education= number of students studying abroad)
- Change the description of the time period in the rubric. (e.g. between 2005 and 2015= from 2005 to 2015, in the years between 2005 and 2015/ over the decade between 2005 and 2015/ Over a 10-year period between 2005 and 2015)
*The rubric is the written description which introduces the graphic.
As you can see, the introduction is similar to the description of the graphic in the question paper. It is important that you change some of the words used. I have underlined the words that have been changed.
You should not spend a lot of time on writing the introduction. One or two sentences is ok. It’s important to have a clear way to write the introduction as quickly as possible.
What you should not do in a task 1 introduction.
1. If you’re not sure whether it’s a synonym, you should not use it. It is better to simply copy the rubric than to paraphrase incorrectly or use the wrong synonym.
2. Do not paraphrase the word ‘below’ in the rubric (The graph below shows the number of…)
3. You do not need to write the measurement for the axis. E.g. Do not write: The x axis is shows countries, the y axis shows number of people’.
Frequently asked questions about task 1 introductions
No. You do not need to paraphrase all the words in the rubric. The most important thing is that you write the introduction quickly so that you have more time for your overview and body paragraphs.
Write it as quickly as you can. You need to prioritise writing your overview and body paragraphs. The maximum amount of time you should spend writing the introduction is 3 minutes.


