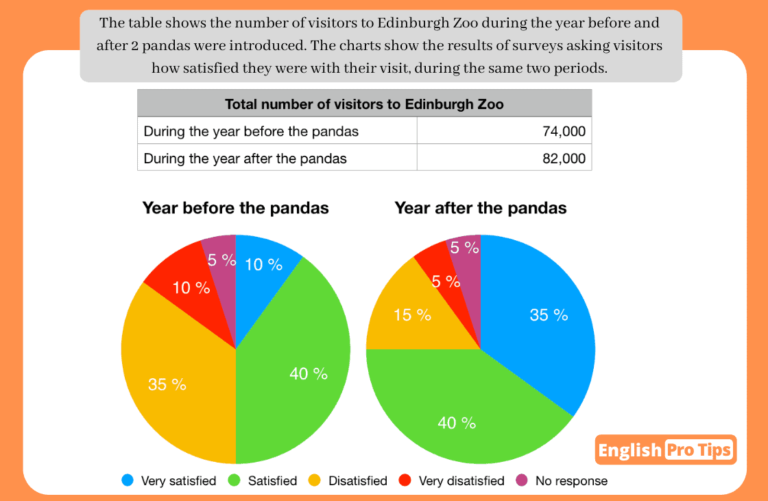
The table gives a comparison of the quantity of guests at Edinburgh Zoo during the previous and the following year they brought in 2 pandas; as well as the report of an inquiry in which visitors were asked how satisfied they were with their tour of the zoo during the same period of time.
Overall, Between those two years, the number of visitors jumped up, the rate of satisfaction levels (very satisfied, satisfied, dissatisfied, very dissatisfied, and no response) shows a substantial increase in satisfaction of those visitors after the bears got into the Zoo.
In the year before the pandas arrive at the Zoo, it has been visited by 74.000 people; the percentage of satisfaction was: 10% of the guests who completed the survey were very satisfied, 40% reported that they were satisfied, 35% said they were dissatisfied, 10% stated that they were very dissatisfied and, only 5% of people did not complete the survey.
The following year when the two bears were the main attraction, the Zoo was visited by 82.000 people; visitors who completed the inquiry reported: 35% of respondents said that they were very satisfied, 40% stated that they were satisfied, 15% reported dissatisfied, and people who were very dissatisfied and those ones who did not respond the survey reported 5% respectively.
The number of people who visited the Edinburgh Zoo during the year after the pandas increased exactly 8.000 visitors; moving on to compare with the previous year, the percentage of high satisfaction has risen 25%, the moderate satisfaction remains the same in both years, the number of dissatisfied respondents was dropped in 20% after the pandas got into the Zoo, the minimal percentage of people dissatisfied, fell 5% since the bears entered while nonrespondents had kept a slight 5%.


Comments
Hi Yully what a nice attempt. If I write this essay, I would probably have a hard time organizing this into a very concise one. I think that you can improve your paraphrasing of the introduction. Using phrases like: “introduction of the pandas” and “results of satisfaction survey” so you don’t have to write “the results of the survey asking visitors how satisfied…”.
Also, when using respectively, usually we write the options in one sentence (satisfied, not satisfied,very satisfied) and then the figures in brackets + respectively. In your case, you don’t have to use the word respectively because you already wrote the figures designated to each options. Let me know if this was clear because I I’m not sure if I explained it well. 🙂
*already wrote the figures right after their designated options..correction to this statement
I understand your advice. Thank you so much for taking the time to read my answer.
Very comprehensive answer Yully! ????
+ Very nice introduction (although you would use a comma where you have a semicolon) Use a semicolon to connect two independent clauses.
+ You have clearly mentioned all of the data in both graphics.
Interesting structure. You have chosen to write a paragraph describing each time period and then a third paragraph that compares the two years. I would personally use a slightly different structure: para 1: total number of visitors to Edinburgh zoo, para 2: how the satisfaction rate changed. Both choices of structure are logical. My fear would be that if you look at each year in separate paragraphs, the analysis might be a bit repetitive and mechanical (which will lower your Task Achievement score).
– Be careful with capital letters: “Overall, Between”
– Small paraphrasing change: “after the bears got into the Zoo.” – “after the two bears were introduced to Edinburgh zoo)
– Some problems with colons and semicolons. We don’t tend to put these in the same sentence. You can find out more in this lesson: https://englishprotips.com/lessons/punctuation-for-task-1/
If this feedback helped you, please take the time to give other members feedback on their writing- they will definitely appreciate it ????
Thanks Eli.