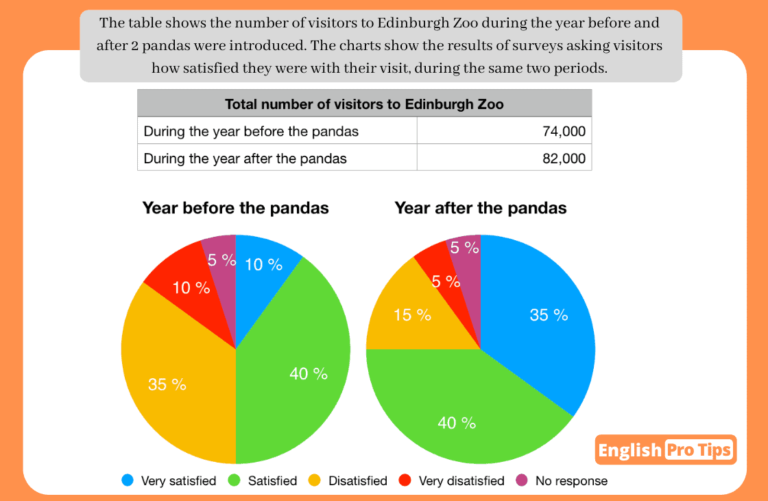
The pie chart illustrates the percentage of satisfaction of visitors of the Edinburgh Zoo, reported in two surveys conducted before and after introducing two pandas.
Overall, the number of visitors increased with the addition of the new pandas from the previous records. While the number proportion of visitors reported very satisfied inclined in the later survey, the percentage of visitors who were very disappointed decreased. However, the satisfied group of visitors remained stable during the two surveys.
From the chart, the improvement in the very satisfied group in the year after getting the pandas to the museum is noted from 10% to 35%. The proportion who were satisfied and did not respond in both the period stayed the same at 40% and 5% respectively.
On the contrary, there was a decline of 20 % in those who reported that they were dissatisfied in the later year than the initial survey at 35%. Similarly, there was 10% of the visitors were very dissatisfied before the arrival of pandas, which reduced to 5% thereafter.

Glin
Community Band Score


 (1 votes, average: 5.00 out of 9)
You need to be a registered member to rate this.
Very good
- Wow, I wish I could write like this. Can you give me some tips?
- This is a really good answer, I can’t see any mistakes.
- Great vocabulary, I didn’t know the word _____ and ______.
- Very clever ideas. They clearly relate to the question.
Good
- Your grammar is very good. However, I think you made a mistake in the sentence _______. I think it should be _______.
- Your introduction/overview is really good. However, I think ______ is a mistake. It should be _________.
- In general, your spelling is good but you misspelled the word ______.


Comments
Appreciate your efforts !
Focus a bit more on the Structure..