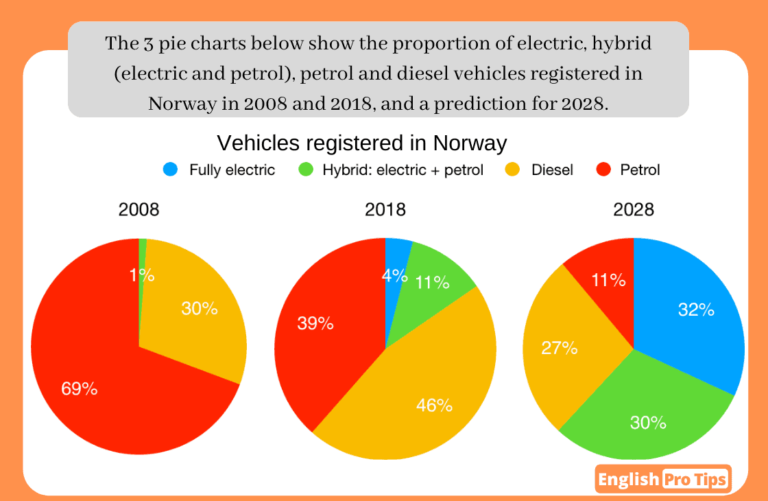
The charts provided present the proportion of various types of vehicles: electric, hybrid (electric and petrol), petrol, and diesel, which were registered in Norway in the period between 2008 and 2018, and a projection for the year 2028.
Overall, while there was a large percentage of vehicles which used petrol for fuel in 2008, its spot had been replaced by diesel-operated vehicles by 2018. In addition, by 2028, it is predicted that Norwegians will have registered more electric-driven vehicles.
Considering the first chart showing the figures for the year 2008, there were only three types of vehicles that dominated Norway: petrol, diesel and those that can be operated with electric and petrol. While petrol-operated vehicles constituted a substantial part of the pie at 69%,diesel came next at almost a third that of petrol (30%). Hybrid vehicles registered only 1%, making it the least popular form of power for vehicles in the aforementioned date.
Looking at the year 2018, a decade after, the trend had changed with the addition of electric-powered vehicles. Although, petrol was the preferred choice ten years ago, diesel fueled-vehicles had become more popular instead at 46%, compared with 39% (that of diesel). Hybrid and fully electric vehicles trailed behind the figures of the former at 11% and 4%, respectively.
The last pie chart shows the future predictions for these vehicles: diesel fueled-vehicles which dominated the market 20 years ago will have decreased in popularity (11%), whereas, fully electric ones will have become the new trend among Norwegians (32%). Unlike diesel which is projected to also decline by almost as half as in 2018 (from 46% to 27%), petrol will have gone down by just a little more than a tenth (11%) that of 2018 figure (39%).


 (2 votes, average: 8.00 out of 9)
Comments
Very nice essay! Keep it up:)
Very nice answer Noemi. I really like your structure and clear topic sentences. I also like your vocabulary- especially using the synonym “petrol-operated vehicle”. Let me correct some small mistakes.
1. You a full stop (not a colon) in the first sentence of the last paragraph. So, “The last pie chart shows the future predictions for these vehicles. Diesel fueled-vehicles
2. “Unlike diesel which is projected to also decline by almost a half its 2018 figure (from 46% to 27%), petrol will …”
3. “by just a little more than a tenth (11%) its 2018 figure (39%)”
Thanks for the feedback teacher..:) My improvement is all because of your relevant lessons.