Examiner Comments
- The response provides a clear and accurate summary of the survey results, covering all three activities shown in the chart across the five cities.
- The introduction paraphrases the task effectively, while the overview identifies the main trends, including the widespread popularity of café visits and the consistently lower figures for fresh coffee purchases.
- Key comparisons are appropriately selected and reported, such as differences between cities and contrasts between instant and fresh coffee.
- The response remains fully focused on the information presented, with no unsupported assumptions or irrelevant detail.
- The report is logically organised, with a clear progression from the overview to more detailed comparisons.
- Each main body paragraph opens with a clear topic sentence, making the structure easy to follow.
- Cohesive devices are used effectively to signal comparison and contrast, contributing to a smooth flow of ideas.
- Paragraphing is consistent and supports clarity throughout.
- A good range of vocabulary is used to describe proportions and comparisons, including expressions such as accounted for, the highest proportions, by comparison, and the only city where.
- Repetition is well controlled through varied phrasing and careful reference to categories and locations.
- Word choice is precise and appropriate for an academic description of data.
- A range of sentence structures is used accurately, including complex sentences that incorporate multiple data points.
- Tense use is consistent and appropriate for reporting survey results.
- The writing is error-free, with no grammatical issues that affect clarity.
Useful Vocabulary
Show information about something.
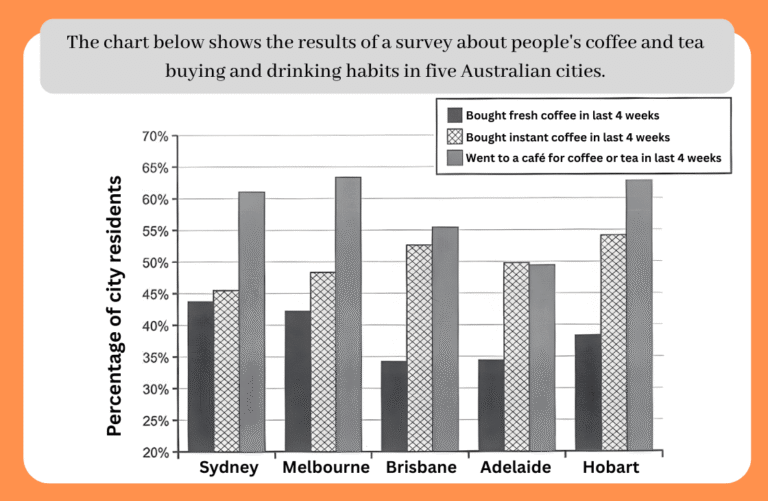
The bar chart presents data on how residents in five Australian cities purchased or consumed coffee and tea over a four-week period, distinguishing between café visits, instant coffee purchases, and fresh coffee purchases.
All except one.
Overall, visiting cafés accounted for the highest proportions in all but one of the cities.
By a large amount.
In contrast, fresh coffee purchases were the least common activity everywhere, with considerably more people choosing instant coffee.
Starting by looking at something.
Turning first to café visits, this activity was the most common form of coffee or tea consumption in the majority of cities.
Had the largest numbers.
Melbourne and Hobart recorded the highest figures, at around the mid-60% range, followed closely by Sydney at just over 60%.
Concerning/about.
With regard to coffee purchases, clear differences can be seen between instant and fresh coffee across the cities.
Varied between two numbers.
Instant coffee buying ranged from about 45% in Sydney to roughly 55% in Hobart, with Brisbane recording a slightly higher proportion than Adelaide at around 53%.
Showing a small additional percentage.
Instant coffee buying ranged from about 45% in Sydney to roughly 55% in Hobart, with Brisbane recording a slightly higher proportion than Adelaide at around 53%.
Clearly or significantly lower.
By comparison, fresh coffee purchases were notably lower in every city, peaking in Sydney at just under 45%.
Seen or recorded in data.
The lowest and most similar figures were observed in Brisbane and Adelaide, where only around 34–35% of residents bought fresh coffee.