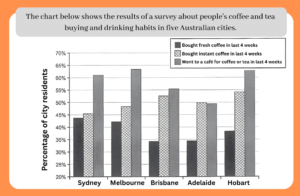
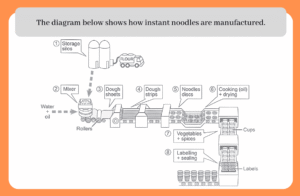
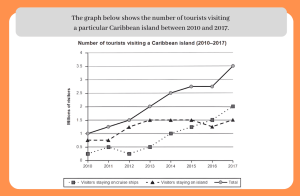
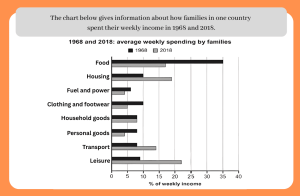
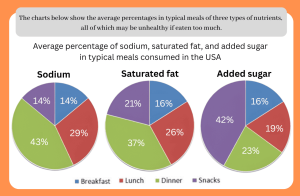
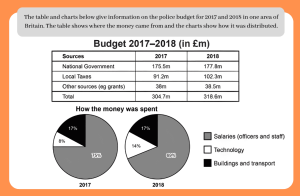
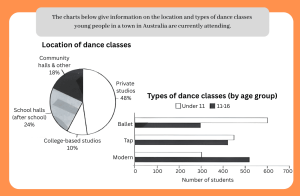
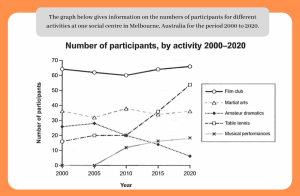
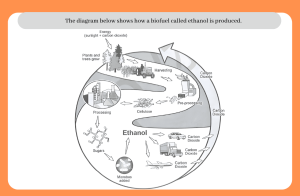
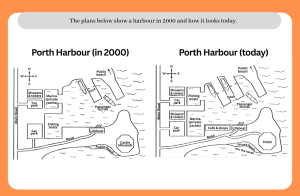
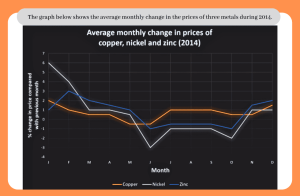
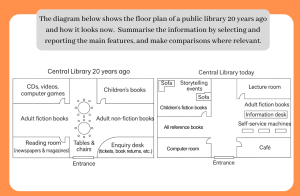
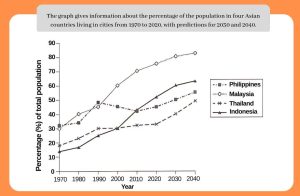
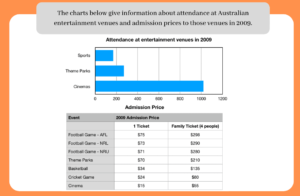
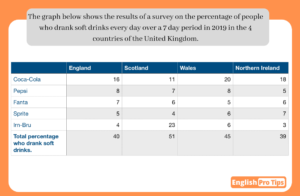
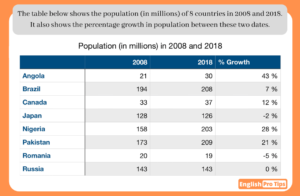
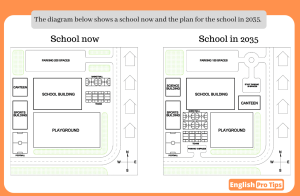
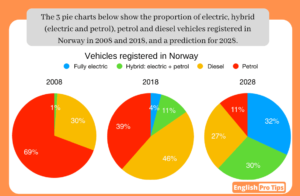
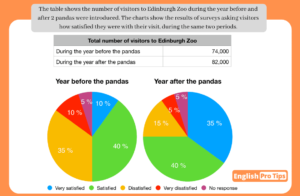
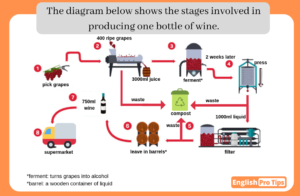
Academic Task 1 Model Answers Task 2 Model Answers Log in or Register to view and download these model answers. Bar Chart Coffee and Tea Habits in Australian Cities Open Essay » Double Graphic Destinations of Anthropology Graduates Open Essay » Process Diagram How Instant Noodles Are Manufactured Open Essay » Premium Only Answers All Bar Chart Double Graphic Line Graph Map Diagram Pie Chart Predictions Process Diagram Table How Instant Noodles Are Manufactured Coffee and Tea Habits in Australian Cities Destinations of Anthropology Graduates Tourists Visiting a Caribbean Island Weekly Income Comparison Three Types of Nutrients in Typical Meals Police Budget Location and Types of Dance Classes Participants for different activities How Ethanol is Produced Harbour in 2000 vs Today Average Monthly Change in Metal Prices Changes to Public Library Floor Plan Percentage of the Population Living in Cities Number of US Households by Annual Income Admission to Entertainment Venues Survey Of Soft Drinks Population Growth School in 2035 Norwegian Vehicles Graduate Jobs Visitors to Edinburgh Zoo Making Wine Income in European Countries