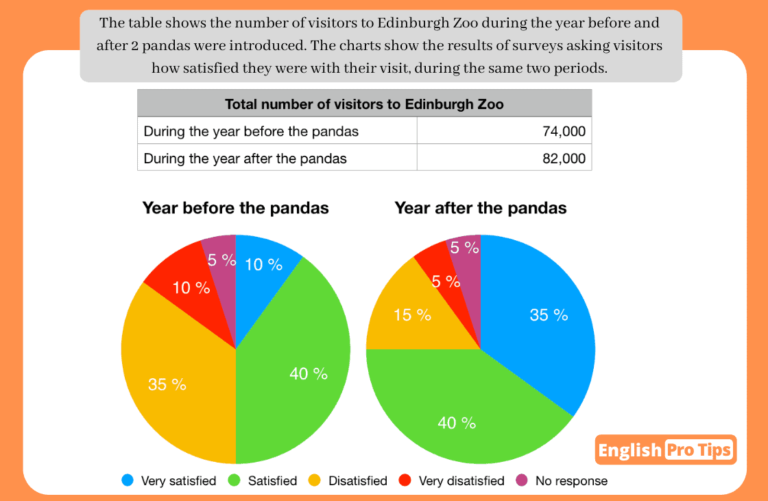
The table gives the amount of visitors, who had visited Edinburgh Zoo, before and after the year that 2 pandas were introduced. The two pie charts also reported the difference of satisfaction from visitors during the same two periods.
Overall, there was a significant increase after 2 pandas were introduces in not only the number of visitors, but also in the percentage of the group of very satisfied. By contrast, the proportion of dissatisfaction experienced a large decrease.
Firstly, Edinburgh Zoo experienced an 8000 people increase after 2 pandas showed up, and the number of visitors reached 82000.
In addition, people reported higher satisfaction level after 2 pandas were introduced, which rose from 10% to 35% in very satisfied group, albeit the percentage of satisfied remained the same. On the other hand, the proportion of dissatisfied and very dissatisfied stated a marked drop by 20% and 5%, respectively. Visitors who didn’t give response leveled out at 5%.


Comments
Very good answer Judy. Your overview is spot on. Also, I like your structure: you look at each graphic in a separate paragraph. Here is my answer to the question, maybe it will help you: https://englishprotips.com/ielts_essays/task-1-visitors-to-edinburgh-zoo-4/
And here are some tips.
1. Try to have more than one sentence in each paragraph (if possible).
2. Revise the use of “albeit” here is an extra lesson that might help you: https://ielts.englishprotips.com/advanced-ielts-vocabulary-for-academic-task-1/