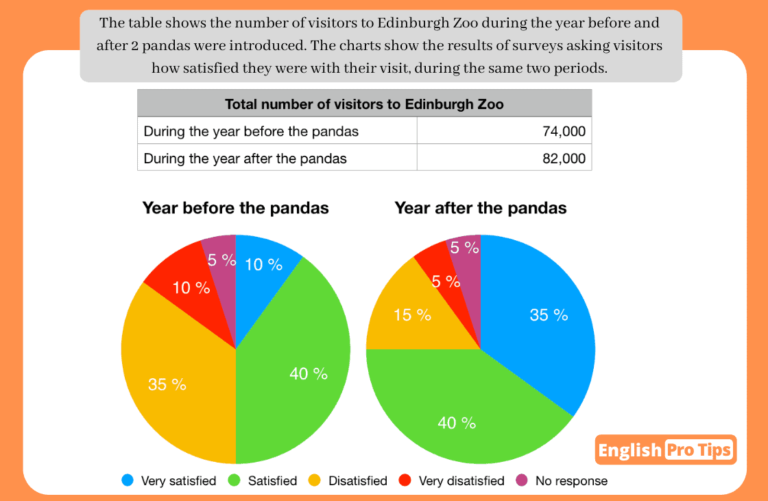
The pie charts below gives the information about percentages of visitors who made visits to Edinburgh Zoo with different levels of satisfaction and total figures for visitors in two separate years before and after introduction of two pandas.
Overall, it can be seen from the charts , the total number of people who visited the Zoo increased dramatically after new arrivals of Zoo animals ,while percentage of guests who were very satisfied rose steadily after the year of pandas. Other categories of visitors who were dissatisfied and very dissatisfied decreased remarkably ,whereas satisfied and no response group of people showed no any noticeable changes.
Looking into more detail, very satisfied people were by far the biggest group who made up the figures in remarkable proportions reaching at 35% starting from just at 10% of Zoo visits, a 25% of growth in visitors .By contrast, another obvious shift can be noted in dissatisfied and very dissatisfied catogery of people after introduction of pandas ,reducing their figures to 15% and 5% starting from the year before pandas at 35% and 10% respectively.
Most surprisingly, the proportions of Zoo lovers who were satisfied with Edinburgh Zoo and the people who did not have any response remained constant during both years at 40% and 5% respectively. The increase of total number of people were around 82,000 after year of pandas in comparison with 74,000 zoo aspirants in the year before the pandas .


Comments
Nice one Deepika, I like the brief introduction (just remember: “after THE introduction of two pandas”)
Also, remember that you don’t need to paraphrase the word “below” in your introduction.
In your overview, you can separate each chart into different sentences. Like this:
“Overall, it can be seen from the table that the total number of people who visited the zoo increased dramatically after the arrival of the two pandas. From the pie-charts, it shows that the number of visitors who were very satisfied with their experience rose, while those who reported feeling dissatisfied shrank substantially. Finally, there was no noticeable change in the number of respondents who were satisfied or didn’t have a response.
I like that you have chosen your structure based on what you have reported in the overview- this is logical. However, I would have put the last sentence (“The increase of total number of people were around 82,000 after year of pandas in comparison with 74,000 zoo aspirants in the year before the pandas”.) in a separate paragraph after your overview. It doesn’t make sense to have it at the end of the second body paragraph.
You also have lots of good linkers like “by contrast”. Try to avoid using “subjective” words like “most surprisingly”.
Thanks sir Eli! I will keep them in my mind.