Task 1- Vehicles in Norway
The fuel characterists of vehicles registered in Norway were presented in 3 pie charts considering the proportion of fully electric, hybrid (eletric and petrol) and
The fuel characterists of vehicles registered in Norway were presented in 3 pie charts considering the proportion of fully electric, hybrid (eletric and petrol) and
The three pie charts present the percentage of four different vehicles registered in Norway in 2008, 2018, and an estimate for 2028. Overall, from 2008
The pie charts illustrate the amount of four different kinds of vehicles (fully electric, hybrid, petrol, diesel) owned by the Norwegian respondents in 2008 and
The three pie charts illustrate the percentages of four types of vehicles: electric, hybrid(electric and petrol), petrol, and diesel possessed in Norway in 2008 and
The 3 pie charts illustrate the amount to four kinds of automobiles legally owned in Norway: electric, hybrid, diesel, petrol, in 2008 and 2018, and
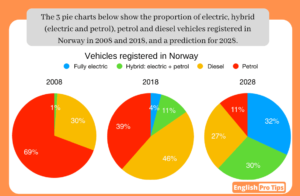
The charts below illustrate the difference in proportions of vehicles registered in Norway: electric, hybrid ( electric and petrol), petrol, and diesel) over a 30
The pie charts illustrates information on the percentage of four kinds of vehicles registered in Norway in two years (2008 and 2018) and a projection
The charts provided present the proportion of various types of vehicles: electric, hybrid (electric and petrol), petrol, and diesel, which were registered in Norway in
The 3 pie charts give information about the proportion of four different energy used in vehicles: electrics, hybrid, petrol, and diesel in Norway in 2008
The three pie charts compare the differences in percentage changes in four various categories of vehicles which have registered in Norway between year 2008 and