Task 1- Soft drink survey
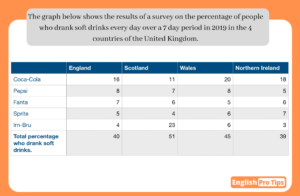
This table depicts the outcomes of a survey on the soft drinks consumption percentage amongst UK residents daily over a week. The survey was conducted
This table depicts the outcomes of a survey on the soft drinks consumption percentage amongst UK residents daily over a week. The survey was conducted
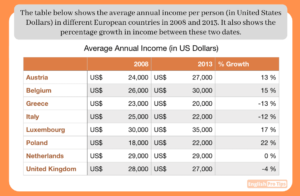
The table illustrates the average annual salary per citizen in different European countries in 2008 and 2013, and also presents the different percentage between these
The table presents data about the amount of money that people from 8 different nations gained per year in average, considering 2 years (2008 and
The table presents the average yearly income of eight European countries in 2008 and 2013. It also gives the proportion growth in income over the
The table provides information about the yearly income per person in eight European Countries in two years 2008 and 2013. The difference in the income

The table provides information about the daily consumption of fizzy drinks over a week of different countries the Uk adults in 2019. The countries included
The table presents information about the average annual income per person, in US dollars, and the percentage growth of the same, in different European countries
The table presents the yearly wage per capita of 8 different European countries over a five year period. Units are measured in United States dollars.
The table shows the proposition of the respondents who drank soft drinks every day over seven days period in 2019 in the four countries of
The table presents the differences of citizens who drank soft drinks per day during a week period in 2009 in England, Scotland, Wales and Northern