Task 1- Soft drink survey
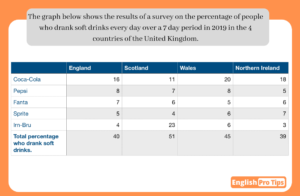
The table gives information about the different types of soft drinks and the proportion of consumers who drank them daily over a week´s period in
The table gives information about the different types of soft drinks and the proportion of consumers who drank them daily over a week´s period in
The table below presents a review of a survey on the percentage of people who consume fizzy drinks in a period of seven days where
The table below gives information about the results of a survey on the percentage of UK citizens who drank soft drinks every day over a
The table below represents the data on percentages of people who consumed soft drinks daily In a week in four different nations in the UK
You are unauthorized to view this page. Username Password Remember Me Forgot Password