Task 1- Visitors to Edinburgh Zoo
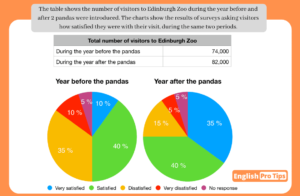
The pie chart illustrates the percentage of satisfaction of visitors of the Edinburgh Zoo, reported in two surveys conducted before and after introducing two pandas.
The pie chart illustrates the percentage of satisfaction of visitors of the Edinburgh Zoo, reported in two surveys conducted before and after introducing two pandas.
The table gives a comparison of the quantity of guests at Edinburgh Zoo during the previous and the following year they brought in 2 pandas;
The table compares the quantity of people visiting Edinburgh zoo in two years (before and after two pandas were introduced) and the two pie charts
The table presents information on the quantity of visitors to Edinburgh Zoo, as well as their satisfaction levels, before and after the introduction of two
The table gives the amount of visitors, who had visited Edinburgh Zoo, before and after the year that 2 pandas were introduced. The two pie
The pie-charts illustrate the percentage of satisfied people who visited Edinburgh Zoo within one year before and after coupe of pandas were appeared. Overall, the
The pie charts below gives the information about percentages of visitors who made visits to Edinburgh Zoo with different levels of satisfaction and total figures
You are unauthorized to view this page. Username Password Remember Me Forgot Password