Task 1- Income in European countries
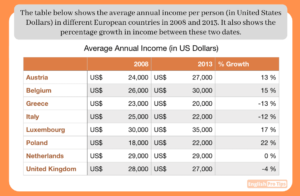
The table illustrates information on average yearly income in US dollar per person in eight European countries in between 2008 and 2013.The percentage growth is
The table illustrates information on average yearly income in US dollar per person in eight European countries in between 2008 and 2013.The percentage growth is
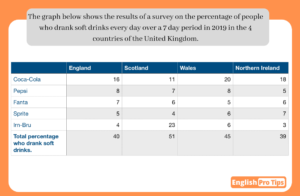
The table presents the answers of a survey on the percentage of people who drank soft drinks every day over a week period in 2019
People from european countries had their average annual income compared in 2008 and 2013 and also the percentage of difference observed between these years. This
The table gives the out-put of the research on the amount of people who consumed soft drinks on daily basis for a period of over
This table illustrates how much the average annual income per person (in US dollars) changed in 8 European countries in 2013 in contrast with 2008.
The table chart illustrates the proportion of carbonated drinks consumption every day during a 7 day period in 2019 in the 4 nations of the
The table illustrates information on the proportion of respondents drinking soft drinks every day in a period of 7 days in 2019 among England, Scotland,
The table presents information on average annual revenue per person (in United States Dollars) in different European countries between 2008 and 2013. Overall, four countries
The table illustrates information on the average annual income per citizen of eight counties in Europe in two years (2008 and 2013). Also, it gives
The given table illustrates the comparison of annual income per person in eight different European countries: Austria, Belgium, Greece, Italy, Luxembourg, Poland, Nrtherlands and United