Task 1- Income in European countries
The table illustrates information on the average annual income per citizen of eight counties in Europe in two years (2008 and 2013). Also, it gives
The table illustrates information on the average annual income per citizen of eight counties in Europe in two years (2008 and 2013). Also, it gives
The given table illustrates the comparison of annual income per person in eight different European countries: Austria, Belgium, Greece, Italy, Luxembourg, Poland, Nrtherlands and United
The table gives a comparison of average yearly income for a person in eight European countries in the year 2008 and 2013, as well as
The table gives the mean income in the US $, of every person per year in eight different countries in Europe (Austria, Belgium, Greece, Italy,
The table presents the yearly income of individuals (in US dollars) in 8 different European countries over a 5-year period, between 2008 and 2013, as
The table presents the average yearly income (in US dollars) of individuals from 8 different countries of Europe (Austria, Belgium,Greece, Italy, Luxembourg, Poland, Netherlands and
This table illustrates a comparison of revenue in a year for person in eight countries from 2008 to 2013. Overall, there are four increased counties
he table gives the difference and percentages in income annually per person in eight countries in Europe basing on two dates 2008 and 2013. Analyzing
The table indicates the individual’s average yearly earning in 8 European countries comparing two years (2008 and 2013) and the income growth ratio. In overall,
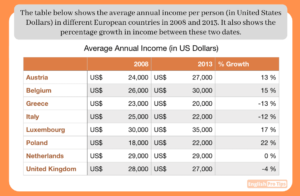
The table below shows the average annual income per person(in united states dollars) in 8 countries in 2008 and2013. It also shows the percentage growth