Task 1- Income in European countries
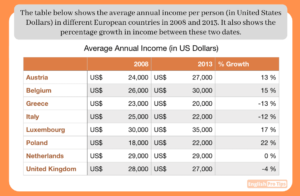
The table gives a comparison of average yearly income for a person in eight European countries in the year 2008 and 2013, as well as
The table gives a comparison of average yearly income for a person in eight European countries in the year 2008 and 2013, as well as
The table gives the mean income in the US $, of every person per year in eight different countries in Europe (Austria, Belgium, Greece, Italy,
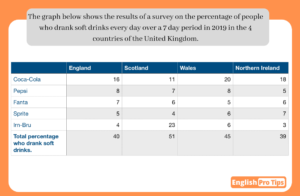
The given table presents the outcome of the research on the proportion of people who consumed soft drinks daily for over a week in the
The table gives information about the survey results on the proportion of consumers who drank different brands of soft drinks everyday (over a week´s period)
The table gives information about the different types of soft drinks and the proportion of consumers who drank them daily over a week´s period in
The table presents the yearly income of individuals (in US dollars) in 8 different European countries over a 5-year period, between 2008 and 2013, as
The table presents the average yearly income (in US dollars) of individuals from 8 different countries of Europe (Austria, Belgium,Greece, Italy, Luxembourg, Poland, Netherlands and
The table below presents a review of a survey on the percentage of people who consume fizzy drinks in a period of seven days where
The table below gives information about the results of a survey on the percentage of UK citizens who drank soft drinks every day over a
This table illustrates a comparison of revenue in a year for person in eight countries from 2008 to 2013. Overall, there are four increased counties